Recent Advances in Cathodoluminescence Imaging Modalities
by Dr. Cameron Chai1, Dr. Kamran Khajehpour1 and Dr. Toon Coenen2
1. AXT Pty Ltd
2. DELMIC B.V
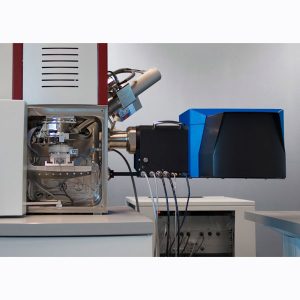
Figure 1. DELMIC SPARC Cathodoluminescence system integrated with a TESCAN MIRA FEG-SEM.
Cathodoluminescence (CL) is an increasingly popular technique that provides information about light-matter interactions at the nanoscale. CL looks at the light (photons) emitted by a sample when subjected to bombardment with an electron beam. CL can provide information about the composition, optoelectronic properties and where there is a relationship between these properties, the morphology and microstructure.
It has been applied to fields such as semiconductors, insulators, photovoltaics, chemical sensors, plasmonics, quantum cryptography, LED lights, ceramics, gemstones, minerals and glasses to generate a better understanding of the structure of these materials at the nanometer scale.
Traditionally, in-house developed systems have been the main way for researchers to collect CL data, which has limited CLs more widespread adoption. Since the release of the DELMIC SPARC CL detection system, the number of publications and conference talks on CL has significantly increased. The DELMIC SPARC is the most versatile and featureful CL detection system available allowing users to obtain CL signals in a variety of modalities such as:
- Intensity mapping
- Hyperspectral CL imaging
- Angle-resolved cathodoluminescence
- Polarisation filtered cathodoluminescence
- Time resolved cathodoluminescence
- Energy-Momentum imaging
We will briefly look at these modalities in the following sections.
Intensity Mapping
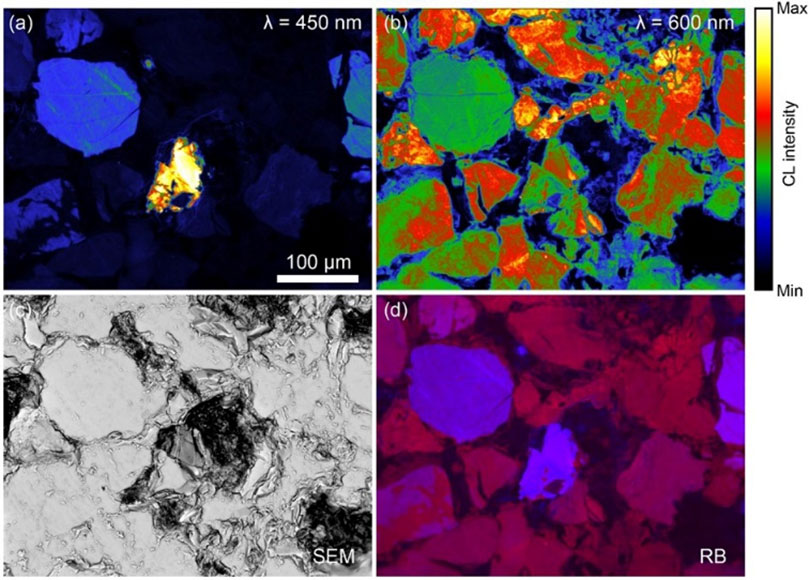
Figure 2. Single-wavelength PMT measurements taken with a (a) 450 nm and a (b) 600 nm band pass filter with a 40 nm bandwidth. (c) SEM image of a sandstone sample corresponding to the region inspected with the PMT. (d) Red-blue color image in which the PMT images in (a) and (b) are placed in the blue and red color channel, respectively. For these measurements the conditions were 40 nA beam current, 15 kV acceleration voltage, and a 40 ?s dwell time. Sample courtesy of Dr. Eric Goergen (Thermo Fischer).
Intensity mapping is the fastest and simplest way to analyse materials using CL contrast. This technique records intensity at every beam position. Two modes of intensity mapping are possible:
- Panchromatic imaging The CL signal is averaged over all wavelengths/colours that fall within specific detection ranges
- Colour filtered CL mapping Uses a bandpass filter
The intensity mapping mode is popular amongst geologist, as the cathodoluminescence emission from a rock can give insights into crystal growth, zonation, cementation, replacement, deformation, provenance, trace elements, and defect structures. This can be used to fingerprint rocks and reveal interesting spatial textures on a submicron scale. CL is often combined with other analytical tools such as SIMS, BSE, EDS, WDS and microCT to provide a more complete understanding of all relevant rock/mineral properties.
DELMIC have recently we have added an automated tiling feature that allows users to analyse large areas by stitching together multiple images.
Hyperspectral Cathodoluminescence Imaging
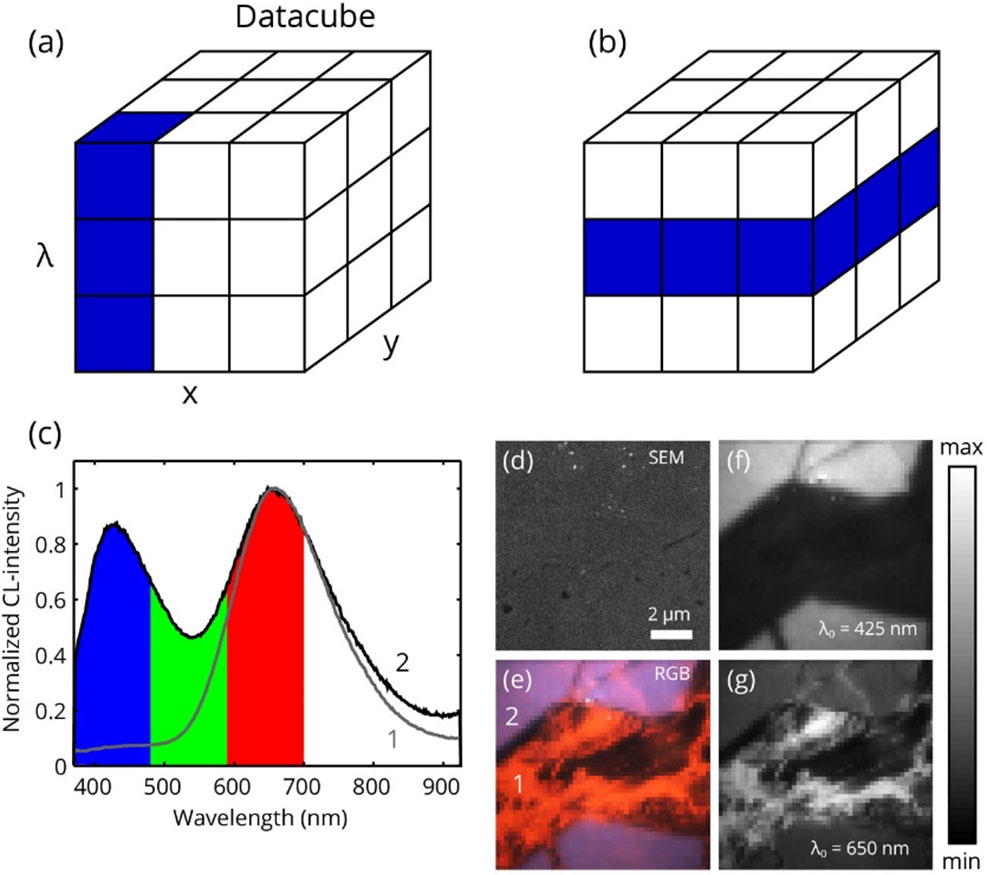
Figure 3. Figure 2 (a) Hyperspectral CL datacube containing the 2D spatial electron beam position and the emission wavelength ?. For each point a full spectrum is collected. (b) From a datacube, it also possible to extract the spatial distribution for a specific wavelength. (c) CL spectra measured on quartz sandstone. (d) SEM image of a region on a quartz sandstone. (e) False color RGB image taken from ? = 380-700 nm as indicated in (c). The positions from which spectra 1 and 2 are collected are also indicated. Wavelength cross cuts through the datacube (shown schematically in (b)) at (f) 425 and (g) 650 nm corresponding to the two main peaks in the quartz.
The CL emission from a material is typically made up of numerous different wavelengths. These individual wavelengths are dictated by factors such as material composition, crystalline structure, configuration and geometry.
Hyperspectral CL imaging enables the user to separate out these various wavelengths in the UV/Vis/IR range and has been the most widely used CL technique. By combining the spectral sensitivity with the high spatial resolution of the cathodoluminescence imaging technique, subtle changes in the output spectrum, defect luminescence, composition and microstructure can be investigated. This can be used for fundamental studies of the physical and chemical processes of ceramics, dielectrics and compound semiconductors in many different fields such as LEDs, photo-sensors, photonic materials, solid state lasers, etc.
Angle-Resolved Cathodoluminescence Imaging
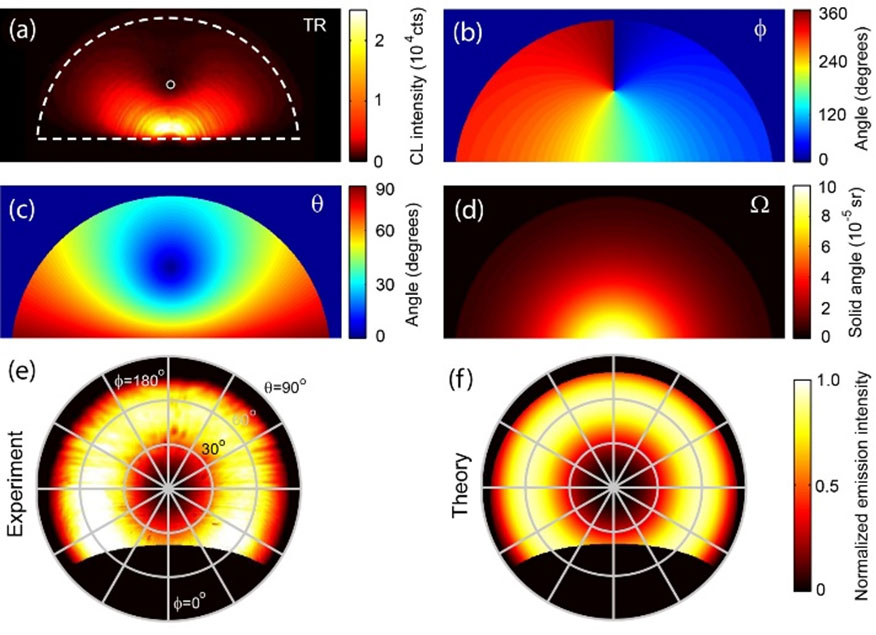
Figure 4. (a) Raw panchromatic CCD image, measured on a single-crystal gold substrate. The white dashed line indicates the mirror contour, and the white circle indicates the position of the hole in the mirror. Maps relating pixel position in the CCD image to (b) zenithal angle ?, (c) azimuthal angle ?, and (d) the solid angle per pixel, allowing conversion to an absolute radiation pattern. (e) Normalized measured panchromatic emission pattern as a function of emission angle. (f) Normalized theoretical emission pattern for gold. [1]
- The performance of antenna structures
- The band structure of periodic systems
By placing colour filters in the optical beam path, researchers can isolate particular spectral features which is important as the angular profile can differ markedly for different emission wavelengths.
Polarisation Filtered Cathodoluminescence Imaging
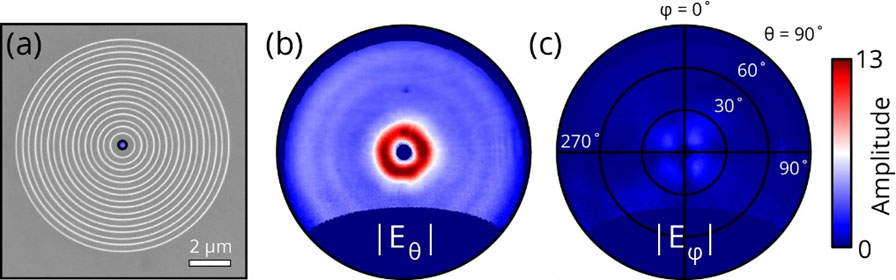
Figure 5. (a) SEM of a plasmonic bulls-eye grating milled into a single -crystal of gold using focused-ion-beam milling. (b) Radial and (c) azimuthal field amplitudes as function of emission angles ? and ? for central electron beam excitation of the bullseye. [2]
The data shown in figure 5 shows the radial and azimuthal electric field amplitudes at different emission angles for a gold plasmonic bullseye grating, measured with CL polarimetry.
Time Resolved Cathodoluminescence Imaging
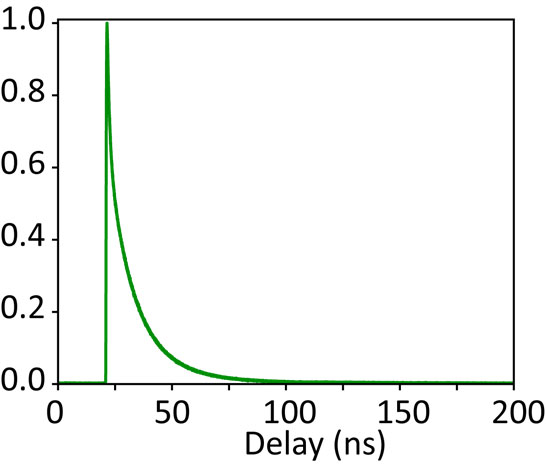
Figure 6. Decaytrace from a InGaN LED wafer, measured with time-resolved CL in a pulsed SEM. Measurement courtesy of Sophie Meuret (AMOLF, Amsterdam).
By modifying the impinging electron beam from an SEM to deliver pulses (rather than a constant beam), researchers can probe the emission dynamics of a materials. The emission dynamics are directly related to the structure of the material. By correlating photon arrival histograms and secondary electron signals, time resolved CL becomes a powerful tool for characterising emission phenomena in light emitting materials and as well as probing the dynamics in photonic nanostructures with high spatial resolution.
Energy-Momentum Imaging
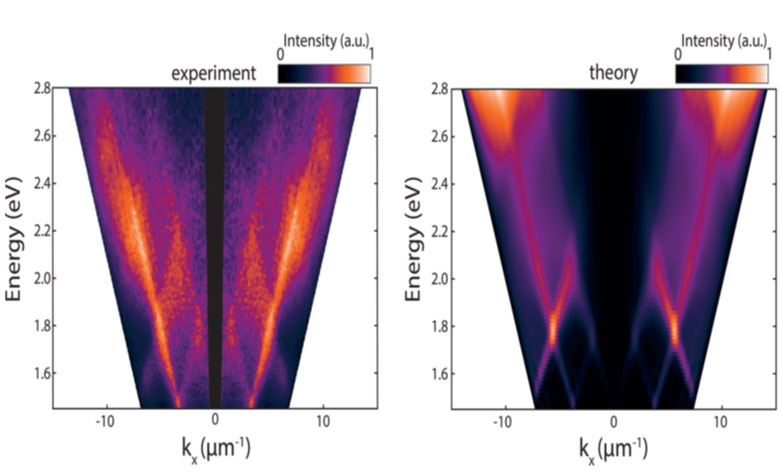
Figure 7. Energy-momentum map and theoretical calculation showing the diffraction from a linear TiN diffraction grating [3].
The DELMIC SPARC Platform
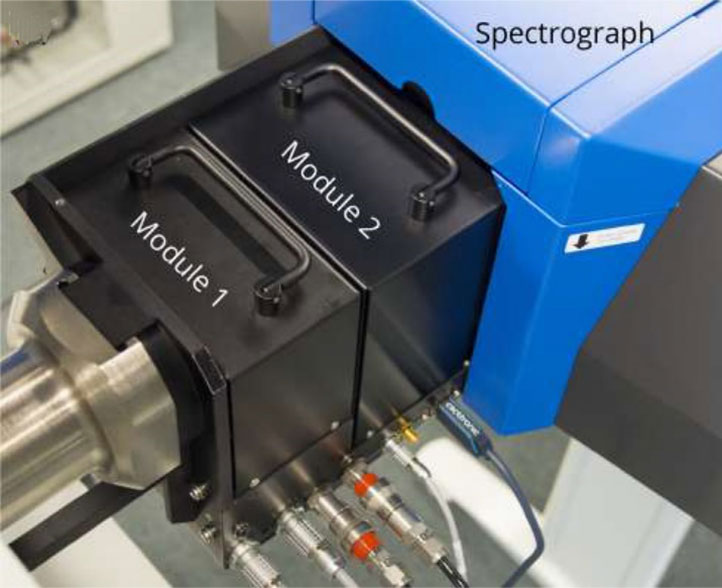
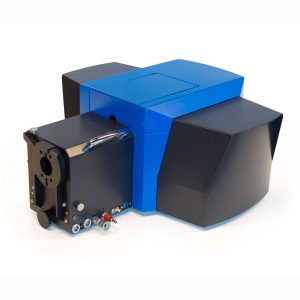
Figure 8 Photograph of the SPARC spectral system showing the optical modules.
The DELMIC SPARC is a module that can be retrofitted to most existing SEM units, similar to adding other peripheral detectors. It is unique in that it can not only offer a range of measurement modes that that no other system can, but also through its design. The design incorporates a retractablemotorised micropositioning stage for parabolic mirror alignment which enables the user to take quantitative measurements with high collection efficiencies.
The SPARC CL system has a modular design. This enables the system to be configured for specific detection functionalities and wavelength ranges to suit the specific requirements of the researcher. The detector has two slots which can accept interchangeable optical modules (figure 8).
References
[1] T. Coenen, E. J. R. Vesseur, and A. Polman, Appl. Phys. Lett. 99, 143103 (2011)
[2] C. I. Osorio, T. Coenen, B. J. M. Brenny, A. Polman, and A. F. Koenderink, ACS Photon. 3, 147 (2016)
[3] S. Mignuzzi, M. Mota, T. Coenen, Y. Li, A. P. Mihai, P. K. Petrov, R. F. M. Oulton, S. A. Maier, and R. Sapienza, ACS Photon. 5, 1381 (2018)