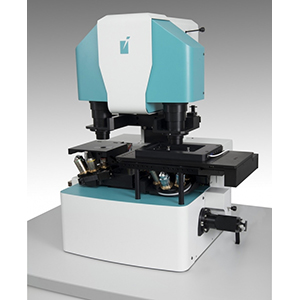
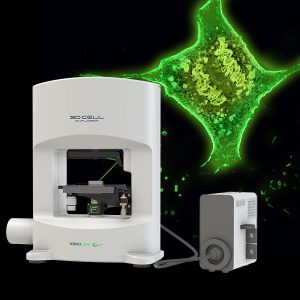
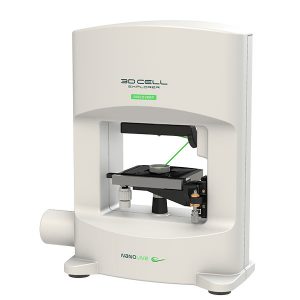
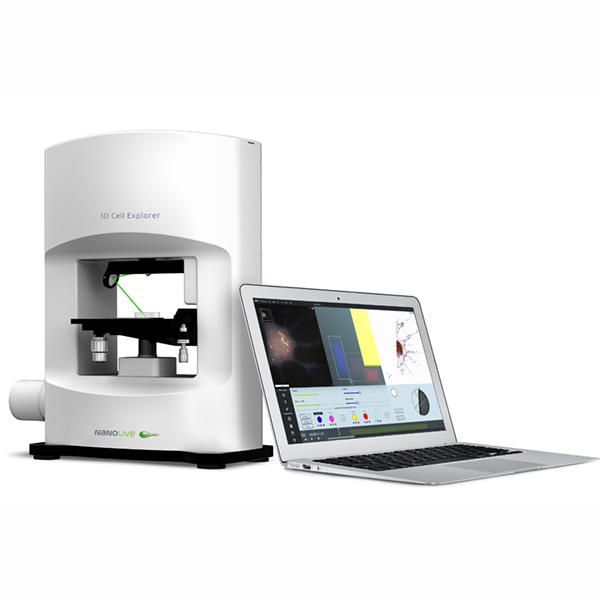
3D Cell Explorer – Tomographic Microscope for Live Cell Imaging
The 3D Cell Explorer is a super-powered laboratory microscope that allows you to peer non-invasively deep into biological systems without damaging or interfering with the cells. It offers high speed and high resolution imaging, producing stunning 3-dimensional images of whole cells in a matter of seconds. Furthermore, it has the highest resolution on the market of any conventional microscope. This combination of features enables you to see exactly how cells behave and interact.
Using sophisticated holographic algorithms, the 3D Cell Explorer is able to generate detailed 3-dimensional stereoscopic visualisations of microbial and cellular life.
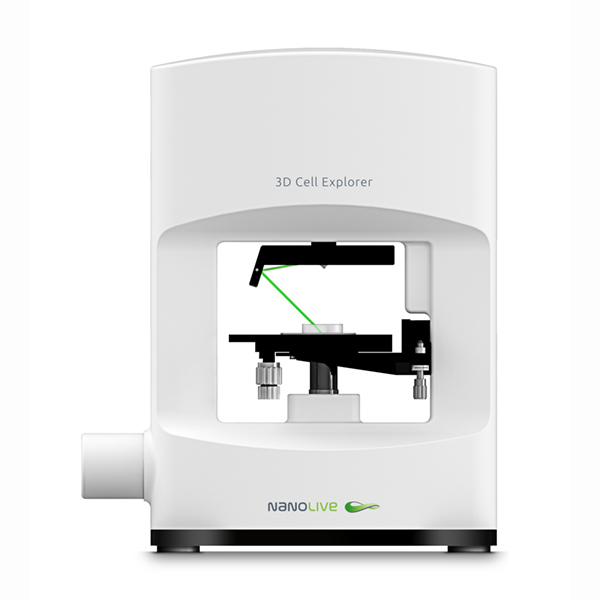
How Does It Work?
The 3D Cell Explorer delivers living cell tomography with contrast similar in nature to an MRI system, but using laser light rather than magnetic fields. Once the cellular specimen is placed in the system, it executes a continuous rotational scan and the associated software package generates a 3D image of the cells on the display almost instantaneously.
Ease-of-Use
The system is both easy to set up and easy to use. However, it is still able to generate high quality images. This makes it well-suited as an educational tool that can be used to let students get up close and personal with cells, providing an interesting and interactive experience
Intuitive Software
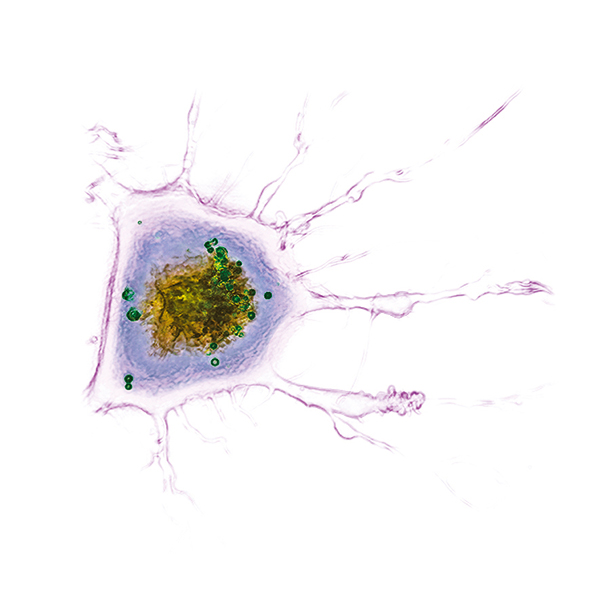
Operators can interact with the system and data produced via STEVE, the intuitive software package. STEVE has the ability to digitally stain single cells using an unlimited choice of colours. Furthermore, STEVE can generate 3D reconstruction in real time.
STEVE also opens up possibilities by allowing you to share, interact, and explore your results. The option is also there allowing you to recreate cells using a 3D printer or 3D hologram to help you get a better understanding of what you are investigating. Alternatively, images can be directly viewed on 3D-beamers or in 3D animations.
Additional Services and Apps
Supplementary services will be available through Nanolives Cloud Biotech Apps and Communities. This will make the 3D Cell Explorer the first cloud microscope.
Applications
The 3D Cell Explorer has a vast array of applications in the field of cellular imaging. It can be used to investigate how cells grow and behave in a given environment. It can also be used to see how cells interact and respond to drugs, treatments and therapies for the investigation of diseases, ailments and infections. The possibilities are endless!
Case Studies
- Visualisation and monitoring of microorganism infections
- Visualisation and monitoring of microorganism internalisation
- Nanoparticle uptake patterns and localisation within a cell
- Real time monitoring of cell morphology during death
- Real time monitoring of intercellular interactions
Visualisation and Monitoring of Microorganism Infections
Some examples include:
- Bacteria infection of mammalian cells
- Assessing morphological changes upon virus infection
- Identification of viral and bacterial inclusion bodies
Live HeLa Cells infected with Chlamydia trachomatis
Left panel – Refractive index distribution within the cells
Right panel – 3D reconstruction
The nucleus is digitally stained in blue, nucleoli in red and the plasma membrane is gold. Chlamydia trachomatis inclusion bodies are displayed in green.
Live HeLa Cells control
Left panel – Refractive index distribution within the cells
Right panel – 3D reconstruction is shown
The control sample is digitally stained with the same color panel as the infected sample.
Samples provided by Deborah Dean, MD, MPH Director, Childrens Global Health Initiative Childrens Hospital Oakland Research Institute (CHORI)
Visualisation and Monitoring of Microorganism Internalisation
- Phagocytosis
- Bacterial intra-cellular trafficking
Bacterial phagosome in live mouse macrophage
Left panel – Refractive index distribution within the cells
Right panel – 3D reconstruction
The nucleus is digitally stained in blue, nucleoli in red and the plasma membrane is green. E.Coli are displayed in yellow.
Macrophages supplied by Beatrice Volpe, UPHARRIS lab, EPFL, Lausanne.
Nanoparticles Uptake Patterns and Localization within the Cell
- Cellular uptake and nanoscale localisation of metal nanoparticles
- Assessments of cell exposure to nanoparticles
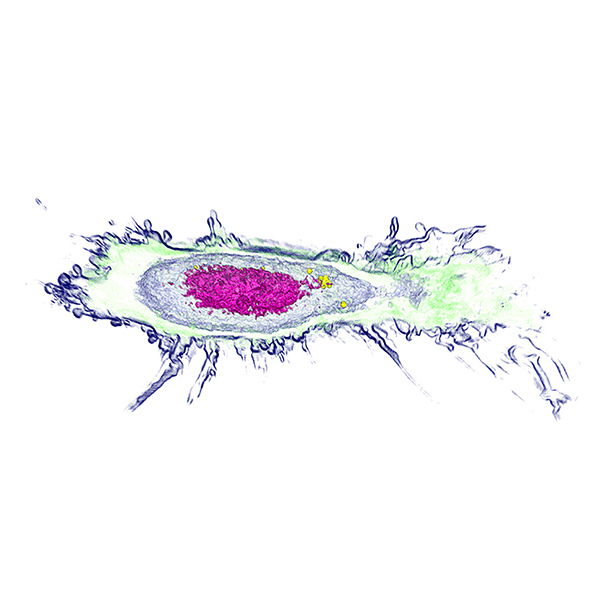
HUVEC cells incubated with gold nanoparticles
Left panel – Refractive index distribution within the cells
Right panel – 3D reconstruction
The nucleus is digitally stained with blue, the cytoplasm with green and the plasma membrane is pink. Gold nanoparticles are displayed in gold.
HUVEC cells control
Left panel – Refractive index distribution within the cells
Right panel – 3D reconstruction
The control sample is digitally stained with the same color panel as the infected sample.
HUVEC (Human Umbilical Vein Endothelial Cells) grown to ?40% confluency in 35mm glass bottom culture dishes (FluoroDishes WPI, #FD35-100) were fixed with 1%PFA for 10-15 minutes and then washed with PBS.
The cells were treated with 40nm BPEI gold nanoparticles.
Samples provided by Dr. Parwathy Chandran and Dr. Nancy A. Monteiro-Riviere Nanotechnology Innovation Center of Kansas State University
HeLa Cells treated with Iron oxide nanoparticles
Left panel – Refractive index distribution within the cells
Right panel – 3D reconstruction
The nucleus is digitally stained with blue, the nucleoli with dark purple and the plasma membrane is light purple. Iron oxide nanoparticles are displayed in gold.
HeLa Cells control
Left panel – Refractive index distribution within the cells
Right panel – 3D reconstruction
The control sample is digitally stained with the same color panel as the infected sample.
HeLa cells (Human cervical cancer cell line) grown to ?30-40% confluency in 35mm glass bottom culture dishes (FluoroDishes WPI, #FD35-100) were fixed with 1%PFA for 10-15 minutes and then washed with PBS.
The cells were treated with 1mg/ml of Iron oxide nanoparticles (7-20nm).
Sample provided by Debora Bonvin, LTP, EPFL, Switzerland
Real Time Monitoring of Cellular Morphology During Cell Death
- Monitor of the three major process of cell death: apoptosis, necrosis and autophagy
- Assess morphological changes associate with cell death
Apoptosis of murine Fibroblastic Reticular cell (FRC)
Refractive index distribution within the cells.
3D reconstruction with the nucleus is digitally stained blue, the nucleoli dark purple and the plasma membrane light blue.
Fibroblast reticular cells grown to ~40% confluency in complete DMEM medium (Dulbeccos Modified Eagle Medium) in 35mm glass bottom culture dishes (FluoroDishes WPI, #FD35-100).
The time-lapse imaging experiment where conducted with heating plate set to 37°C for 1h 15 minutes capturing images every 5 minutes.
Sample provided by Rosamaria Cannavo, UPNAE lab, EPFL, Switzerland
Apoptosis of a Fibroblastic Reticular Cell (FRC)
3D reconstruction with the nucleus digitally stained dark green, nucleoli red and the plasma membrane light green.
Fibroblast reticular cells seeded (?1×10⁴ cells) in 35mm glass bottom culture dishes (FluoroDishes WPI, #FD35-100) and grown to ?20-30% confluency in complete DMEM medium (Dulbeccos Modified Eagle Medium).
Cells were imaged using imaging buffer (PBS + 25mM Glucose + 10mM HEPES). The time-lapse imaging experiment where conducted at RT for 50 minutes capturing images every second.
Sample provided by LLCB lab, EPFL, Switzerland
Real Time Monitoring of Intercellular Interactions
- Morphological and quantitative tracking of cells of interest
- Morphological assessment of cell-cell interaction
Living T-cell killing a living cancer cell
Left panel – Refractive index distribution within the cells
Right panel – 3D reconstruction is shown
The nucleus is digitally stained in purple and the plasma membrane is violet.
ID8-ova cells (ID8 murine ovarian tumor cell line transduced with ovalbumin) seeded (~2×10⁴ cells) in 35mm glass bottom culture dishes (FluoroDishes WPI, #FD35-100) and grown to ~20-30% confluency in complete DMEM medium (Dulbeccos Modified Eagle Medium). The cells were incubated with ~5×10⁵ T-cells.
Cells were imaged using imaging buffer (PBS + 25mM Glucose + 10mM HEPES). The time-lapse imaging experiment where conducted at RT for 41 minutes capturing images every second.
Samples provided by LLCB lab, EPFL, Switzerland
Living T-cell interacting with a living antigen presenting cell
Left panel – Refractive index distribution within the cells
Right panel – 3D reconstruction with the nucleus is digitally stained green and the plasma membrane violet.
Fibroblast reticular cells seeded (~2×10⁴ cells) in 35mm glass bottom culture dishes (FluoroDishes WPI, #FD35-100) and grown to ~20-30% confluency in complete DMEM medium (Dulbeccos Modified Eagle Medium). The cells were previously treated to express antigen specific receptors for T-cells, and then incubated with ~5×10⁵ T-cells.
Cells were imaged using imaging buffer (PBS + 25mM Glucose + 10mM HEPES). The time-lapse imaging experiment where conducted at RT for 45 minutes capturing images every second.
Best Digital Staining Practices
Videos
Detailed Introduction to the Nanolive 3D Cell Explorer including Operation and Digital Staining
Stem Cells – Long-Term Live Cell Imaging
Mouse embryonic stem cells recorded over a 48hr period.